Electricity price by price area: why north and south pay so differently
On an ordinary evening, electricity can cost fourteen times more in south-western Norway than in northern Norway. The power flow on the map shows why.
The electricity price in Norway is not one price. The country is divided into five price areas, and on an ordinary evening electricity can cost more than ten times as much in the south as in the north. Kartradar shows the price in each area and where the power is flowing between them right now. Here is how to read it, and why the prices end up so different.
The five price areas
| Area | Roughly |
|---|---|
| NO1 | Eastern Norway |
| NO2 | Southern and south-western Norway |
| NO3 | Central Norway |
| NO4 | Northern Norway |
| NO5 | Western Norway |
The borders do not follow the county borders exactly. There is no open map of the exact borders, so Kartradar colours each county by the price area it mainly belongs to. It is an approximation, and in border districts, especially around Trøndelag, Møre og Romsdal and Innlandet, your county may be in a different area than the colour shows.
A snapshot
On a Monday evening at nine in October 2026, the spot price was:
| Area | NOK per kWh |
|---|---|
| NO2 South-west | 1.58 |
| NO1 East | 1.48 |
| NO5 West | 1.36 |
| NO3 Central | 0.82 |
| NO4 North | 0.11 |
Electricity cost fourteen times as much in south-western Norway as in northern Norway in the same hour.
The prices are spot prices from the power exchange, without grid fees and taxes. What you pay in total depends on your contract, the grid fee where you live, and the electricity subsidy.
Why the prices end up so different
The price in each area is set by supply and demand, but power can only be moved as far as the cables and lines allow. When the connections between the areas are full, cheap power from one area cannot meet the demand in another, and the prices separate.
The same evening, Statnett's measurements showed exactly that:
- NO2 exported around 4100 MW abroad: to Great Britain (1450 MW), Germany (1120 MW), Denmark (910 MW) and the Netherlands (620 MW). South-western Norway is connected to the same markets as Europe, and the price there is pulled towards European prices.
- Power flowed south and east: from western Norway towards eastern Norway (1700 MW) and southern Norway (680 MW), from eastern Norway on to southern Norway (1600 MW), and from northern Norway towards central Norway (390 MW). Eastern Norway also received 1130 MW from Sweden.
- Northern Norway had more power than it could send south. The price there then falls towards zero, even though it is high further south.
How to read it on the map
- Turn on "Spot prices (NO1-NO5)" under "More layers". The counties are coloured by the price in their area, and you see the price for the current period.
- Turn on "Nordic power flow (Statnett)". The lines between the areas show how much power is going where, and the arrows show the direction. The thicker the line, the more power.
- Turn on "Reservoir levels (NO1-NO5)" as well. It shows how full the hydro reservoirs are, which is the most important explanation of the price over weeks and months.
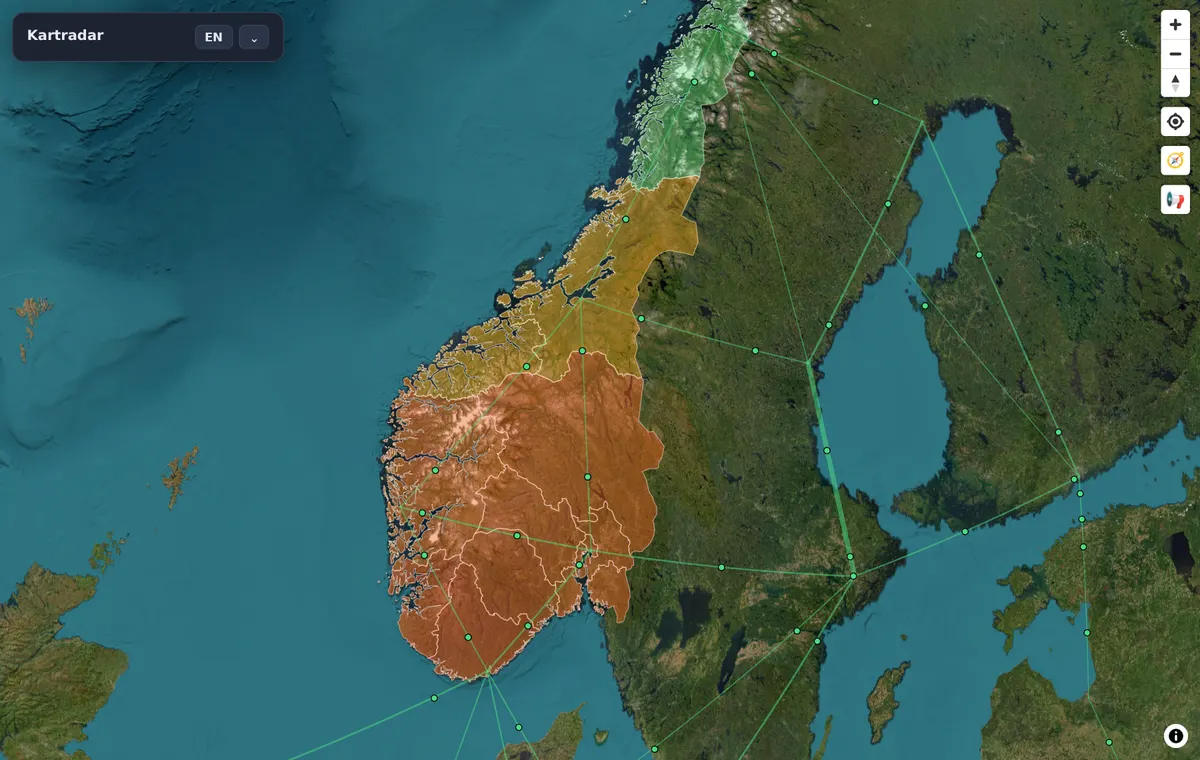
The power flow is updated every minute at Statnett. Spot prices are set the day before, so tomorrow's price is known this afternoon.
Where the data comes from
The spot prices come from hvakosterstrommen.no, which gets them from the power exchange. The power flow comes from Statnett, which operates the grid, and the reservoir levels from NVE. Kartradar recalculates none of it, but brings it together on the same map.